Fed rate outlook, the answer for this June meeting is actually predetermined. Markets are pricing in a 98% probability that the Federal Open Market Committee (FOMC) will hold rates steady at 3.50–3.75% on June 16–17. Yet the meeting still matters for other reasons. The May CPI, released on June 10, printed at +4.2% year-over-year—the highest in more than three years—while incoming Chair Kevin Walsh leads a divided committee for the first time. Most importantly, the quarterly “dot plot” will be published. The real news is not the hold itself, but how the Fed maps the path ahead. That map will shape the next chapter for both the global economy and Korea’s.
- The June 16–17 FOMC is widely expected to hold rates (market probability ~98%). The policy rate is projected to remain at 3.50–3.75%.
- The focal point is not the decision but the dot plot (SEP). If the 2026 median sits near 3.4%, markets will read it as a delay, not a cancellation, of cuts.
- This is incoming Chair Kevin Walsh’s first meeting (appointed May 15). Coordinating a committee split between hawks and doves will be his immediate test.
- More than 60% of the May CPI rise (+4.2%) came from energy. Core inflation was +2.9%, leaving the Fed constrained by oil prices it cannot control.
- The global economy is slowing amid divergence. The World Bank’s early-year forecast of 2.6% growth and cooling inflation for 2026 predates the war and oil spike.
- Korea is enjoying a semiconductor boom (exports +4.6%, growth forecast raised to 2.6%) while the won remains weak (exchange rate in the 1,500 won range). The Bank of Korea has now held rates at 2.50% for eight consecutive meetings.
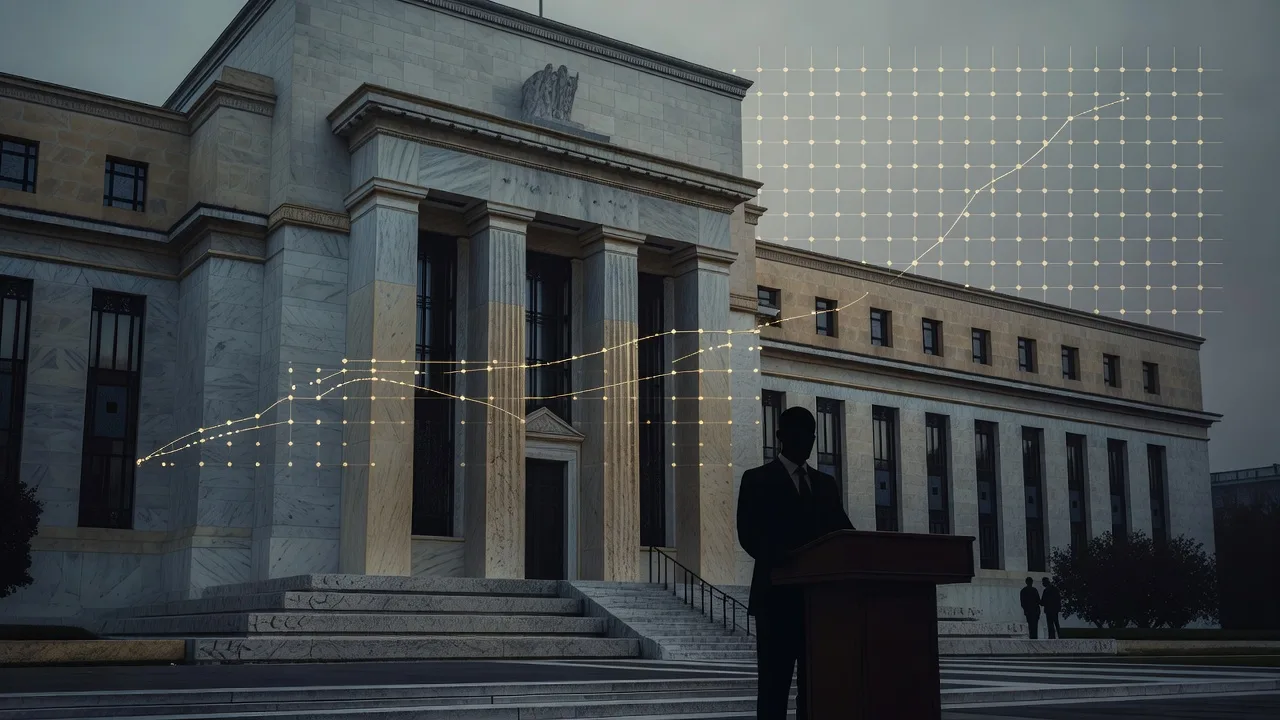
Fed rate outlook — June meeting: what is the real point of interest
Start with the decision itself. CME FedWatch shows markets have already priced in a roughly 98% chance of a hold in June. Persistent inflation and solid employment have anchored expectations firmly at “neither hike nor cut.” So the rate decision itself is not news. The real weight of this Fed rate outlook rests on the Summary of Economic Projections (SEP) and its dot plot, released at the same time.
The dot plot is the real news
The dot plot shows each official’s view of the appropriate policy rate over time. Markets focus on the 2026 year-end median. If that median stays near 3.4%, investors will interpret it as a delay rather than a cancellation of cuts. If the dots shift higher, tighter financial conditions can emerge even without an actual hike. Short-term Treasury yields would move, the dollar would strengthen, and gold would face pressure from higher real rates. In short, the placement of a single dot can fine-tune the direction of asset markets across the board.
Walsh’s debut and a divided committee
This meeting also marks Kevin Walsh’s first as chair. He took over from Powell on May 15 and inherited a committee split between doves pushing for faster cuts and hawks wanting more inflation control. The tone of his press conference and the dispersion of the dots will reveal whether the committee is coalescing or fracturing. Markets will parse every sentence for clues on whether Walsh leans hawkish or seeks to reassure markets.
Hold probability ~98% · Policy rate 3.50–3.75% · May CPI +4.2% (core +2.9%) · Next CPI release July 14. The key inflection point is whether the 2026 dot-plot median holds near 3.4%—the line between “delayed cuts” and “canceled cuts.”
How CPI at 4.2% ties the Fed’s hands
The fundamental reason the Fed is boxed into a hold lies in the nature of the inflation. More than 60% of the May CPI increase came from energy; core inflation (excluding food and energy) was a milder +2.9%. Today’s inflation is not demand-driven overheating but cost-push pressure from war-related oil prices. The problem is that the Fed cannot control oil prices. Raising rates will not reopen the Strait of Hormuz. This dynamic is explored in detail in the Fed is fighting Hormuz, not inflation.
The Fed is therefore caught in a dilemma. Inflation alone argues for tighter policy, yet growth is already cooling (Q1 GDP +1.6%). Hiking rates now would further weigh on activity. The realistic choice is to keep rates “higher for longer” and wait for oil prices to subside. The longer this wait continues, the more the calculus for safe and risky assets shifts. Gold’s recent short-term correction, for example, fits this narrative and is covered in Gold price outlook — why gold fell despite war. The war backdrop driving all volatility is summarized in U.S.–Iran clash: strike-warning cycle.
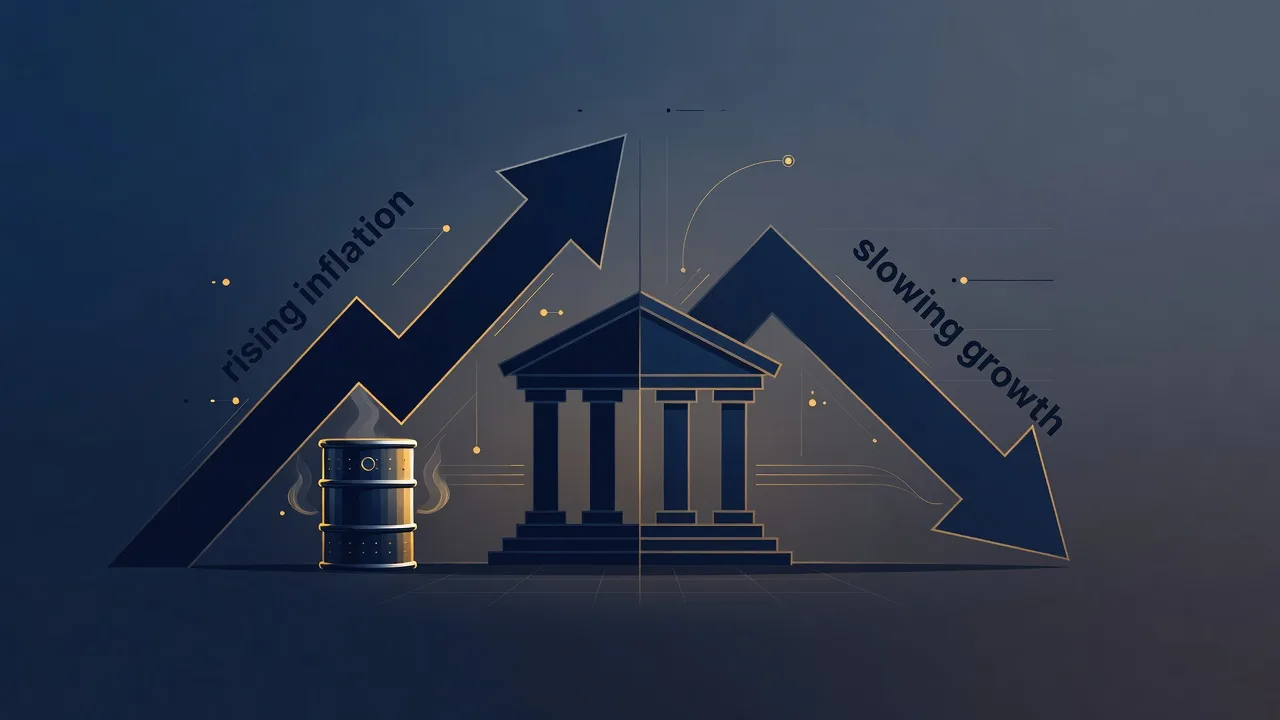
Fed rate outlook and the global economy — slowdown with divergence
The Fed’s next move ripples far beyond the United States. Persistently high U.S. rates strengthen the dollar, exposing emerging markets to capital outflows, currency weakness, and rising import prices. Earlier this year the picture looked milder: the World Bank projected 2.6% global growth for 2026 with cooling inflation, assuming energy prices would stabilize. That forecast, however, rested on a critical assumption—“lower energy prices”—that no longer holds after the U.S.–Iran conflict and the surge in oil.
The revised baseline now points to stagflation risk: slower growth paired with stickier inflation. IMF updates and Korea’s semiconductor illusion are examined in depth in IMF World Economic Outlook 2026 — stagflation has begun. The global economy is therefore navigating an uncomfortable mix of slowing growth and sticky prices, with sharply diverging regional outcomes.
Regional temperature differences are clear. East Asia and the Pacific are slowing but still growing above 4%, while South Asia leads at around 6%. Europe, by contrast, is stuck in the low-2% range. The longer the United States keeps rates elevated, the heavier the dollar’s bill becomes for regions with weaker growth momentum.
A strong dollar has two faces: it draws capital to the U.S. as a safe haven in times of stress, yet it simultaneously raises debt-servicing costs for dollar borrowers in emerging markets. As long as U.S. rates remain high, this suction effect is unlikely to fade quickly. Currency weakness → higher import prices → tighter policy is a loop now repeating across multiple economies. The June dot plot is therefore not just a U.S. story; it is a signal that recalibrates financial conditions for the entire dollar-exposed world. In that sense, Fed rate outlook directly redraws the map of global capital flows.
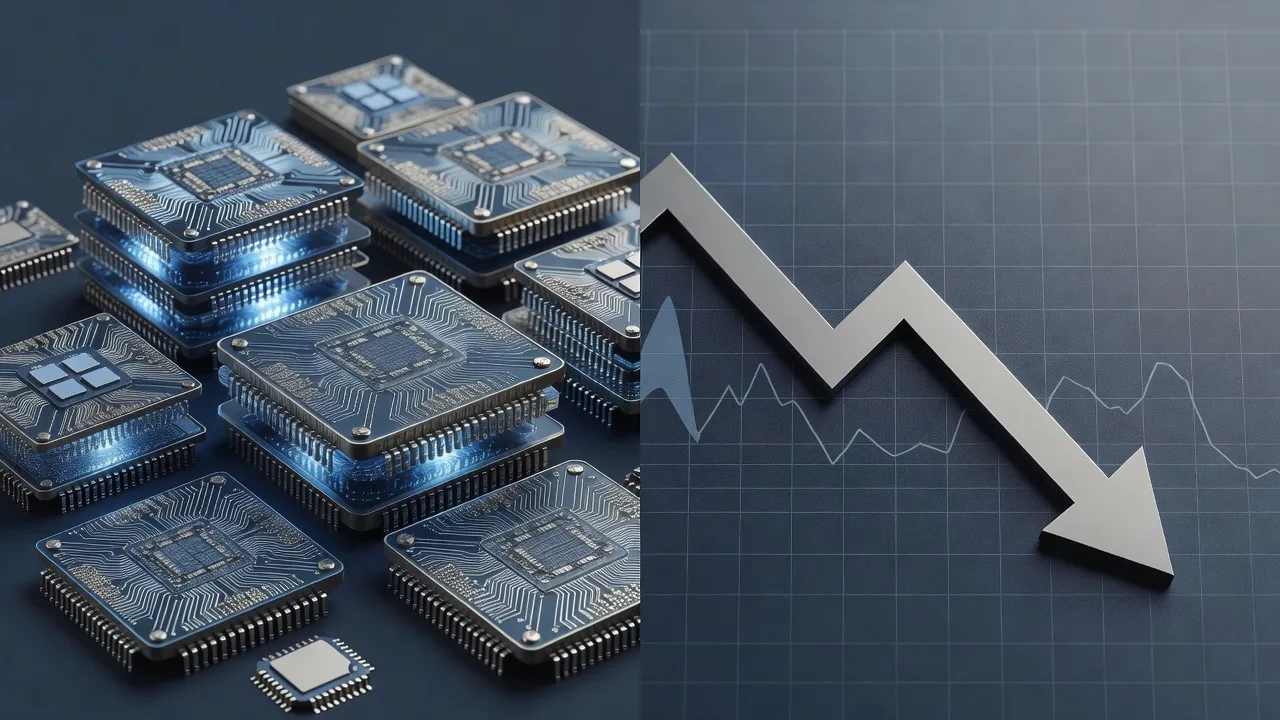
Fed rate outlook and Korea’s economy — semiconductor boom meets weak won
Korea is navigating this environment in a particularly complex way. Good and bad news are tightly intertwined. The good news is semiconductors. AI-driven demand has pushed semiconductor exports well above expectations, with 2026 export growth now seen at roughly 4.6%. Thanks to this, the Bank of Korea raised its 2026 growth forecast from 2.0% to 2.6%. The bad news is the won. The USD/KRW rate briefly touched 1,549 won in early June, locking in a high exchange rate in the mid-1,400s to 1,500s.
Semiconductors support, the exchange rate weighs
The root of the weak won lies in the Fed rate outlook. While the United States holds rates at 3.50–3.75%, Korea’s policy rate sits at 2.50%. The roughly 1-percentage-point gap has pulled capital toward the dollar and pressured the won. Even if the Bank of Korea wants to cut for growth reasons, widening the rate differential would only push the exchange rate higher and import prices up. Until the Fed pivots to easing, the Bank of Korea’s hands remain tied as well.
Oil prices compound the problem. A weak won plus higher oil prices doubles the won cost of imported crude. Import-price inflation feeds quickly into consumer prices. Practical implications for households and policy responses are covered in Hormuz double blockade: oil, prices, exchange rate, and interest rates and Mortgage-rate comparison and stress DSR phase 3. For the exchange-rate trajectory itself, see 2026 USD/KRW outlook.
① Rate differential — U.S. 3.50–3.75% vs Korea 2.50%. The gap pressures the won and narrows the Bank of Korea’s easing room. ② Exchange rate & prices — 1,500-won range plus higher oil = rising import costs. ③ Assets & sentiment — prolonged strong dollar and high rates amplify risky-asset volatility. The semiconductor boom may mask deeper strains in domestic demand, the exchange rate, and inflation.
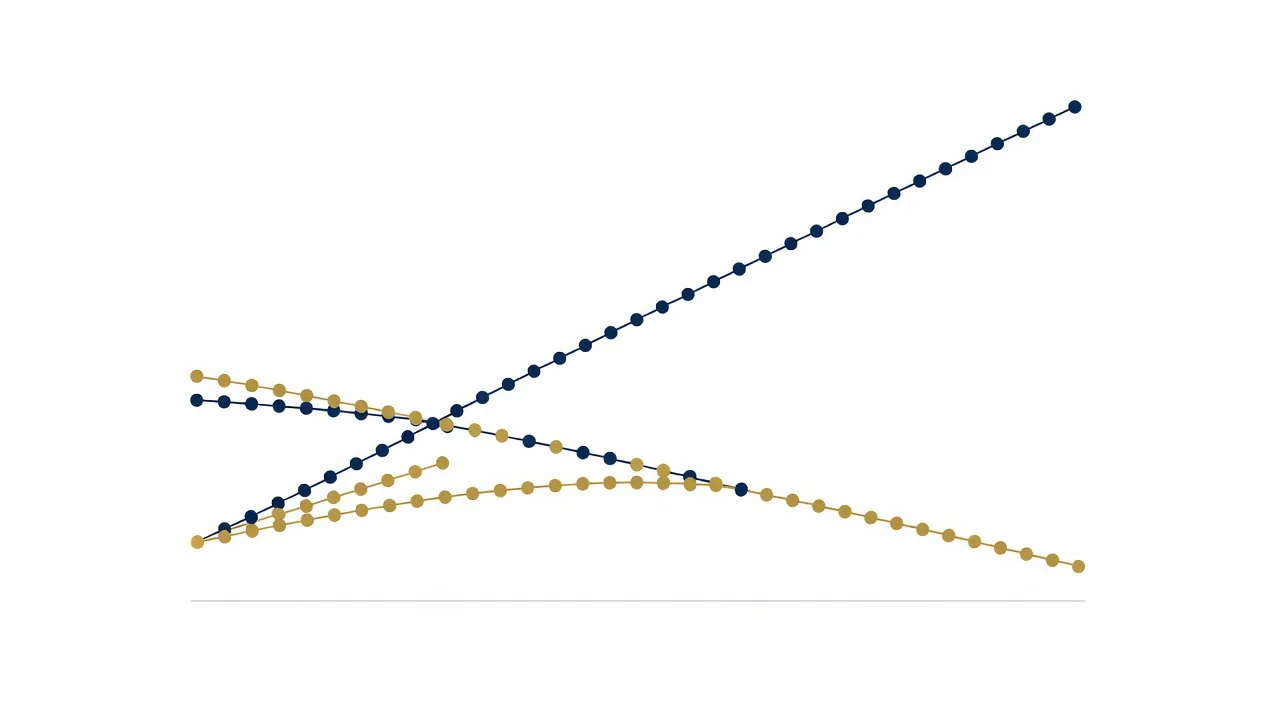
Fed rate outlook scenarios — three paths for the dot plot
The hold itself is already priced in; the dot plot will determine the direction. Three scenarios follow.
A. Delayed cuts maintained (probability: medium-high)
2026 median stays near 3.4%. Markets read “cuts still alive this year,” capping the dollar and yields. Risk assets benefit; the won gains breathing room.
B. Upward shift in dots (probability: medium-low)
Oil-driven inflation pushes the median higher. Tightening occurs without a hike, extending dollar strength and high rates. Pressure on the won and emerging markets.
C. Dovish surprise (probability: low)
Chair Walsh emphasizes growth slowdown and brings forward easing signals. Unlikely given CPI at 4.2%; any such move would risk credibility questions.
In summary, the core of the June FOMC is not the “hold” answer but the “path forward” question. The Fed is sidelined by oil prices and choosing to wait and see. The global economy is diverging between slowdown and sticky inflation. Korea is carrying both a semiconductor boom and a weak won at the same time. A single dot or a single sentence from the chair can shift the entire balance. This Fed rate outlook therefore marks not an ending, but the beginning of the next phase.
Related analysis worth reading
The immediate post-Iran-war FOMC is dissected in First FOMC after Iran war — stagflation formalized?. Survival strategies for Korean investors facing oil and exchange-rate shocks appear in Stagflation formalized — three-stage survival strategy.
📚 Reference materials
- Federal Reserve — FOMC calendar and materials
- CME FedWatch — rate probabilities
- World Bank — Global Economic Prospects
- Bank of Korea — monetary policy and economic outlook
This article provides information on monetary policy and macroeconomic trends and does not constitute investment advice or a recommendation to buy or sell any specific product. Interest-rate, exchange-rate, growth, and inflation figures are as of the time of writing and may change with new data releases or market conditions. Investment decisions and responsibility rest solely with the reader.
Frequently asked questions (FAQ)
Markets assign roughly a 98% probability that the June 16–17 FOMC will hold the policy rate at 3.50–3.75%. Persistent inflation (May CPI +4.2%) and solid employment have anchored that expectation. The key variable is not the decision itself but the path signaled by the dot plot (SEP).
The dot plot shows each Fed official’s view of the appropriate policy rate. If the 2026 median stays near 3.4%, markets interpret it as a delay rather than a cancellation of cuts. If the dots move higher, tighter financial conditions can emerge without an actual rate hike, supporting a stronger dollar and higher yields.
Three channels matter. First, the rate gap between the U.S. (3.50–3.75%) and Korea (2.50%) pressures the won and limits the Bank of Korea’s easing room. Second, a weak won combined with higher oil prices raises import costs. Third, even if the Bank of Korea wants to cut for growth, the wider rate differential constrains its options.
Early in the year the World Bank projected 2.6% global growth and cooling inflation for 2026, assuming stable energy prices. The U.S.–Iran conflict and oil spike have overturned that assumption. Growth is slowing while inflation remains sticky, raising stagflation risks, with wide regional divergences.
Semiconductor exports have lifted the 2026 growth forecast from 2.0% to 2.6%, yet this masks underlying weaknesses. A weak won (around 1,500), rising import prices, and subdued domestic demand are less visible behind the headline export strength. One strong sector does not guarantee broad economic resilience.