It is time to revisit the bitcoin outlook. On June 14, the United States and Iran reached a peace agreement ending nearly four months of war, with an electronic signing set for June 19 in Switzerland. President Trump even floated the reopening of the Strait of Hormuz. Conventional wisdom says that when a war ends, safe-haven assets should fall as their “war premium” drains away. Yet the market’s gaze points the other way — peace, paradoxically, could lift gold, silver and bitcoin again. The key to this counterintuitive view is not “war” but “the Fed.” The logic: the truce pushes oil lower, that accelerates the Fed’s rate cuts, and a weaker dollar lifts safe havens and risk assets at the same time.
- The US and Iran agreed to end the war, with a signing set for June 19 in Switzerland. Talk of reopening Hormuz has increased downward pressure on oil.
- The paradox at the core — peace → stable oil → cooling inflation → Fed cuts → weak dollar and low rates. This chain supports gold, silver and bitcoin simultaneously.
- Even as gold’s war premium fades, rate cuts, a softer dollar and central-bank buying provide support. Major investment-bank targets cluster at $4,500–5,000 (Goldman: $4,900).
- Silver is the “high beta.” When gold rises, it rises more — and falls harder. Year-end forecasts run $65–95, with extreme figures cited if supply tightens.
- Bitcoin is named the top beneficiary of rate cuts and a weak dollar, but its volatility is the highest. Price forecasts vary wildly by institution.
- For Korean investors, the won/dollar rate is a variable. FX gains or losses on dollar assets shape returns. Splitting purchases and diversifying are key.

June 19 Truce — What Changes
First, the facts. Mediated by Pakistan, the US and Iran agreed to immediately and permanently halt military operations across all fronts, with the signing ceremony to be held electronically on June 19 in Switzerland. The most important change is the Strait of Hormuz. If this chokepoint — through which about 20% of the world’s oil passes and which was effectively shut during the war — reopens, oil prices face downward pressure. Given that the two sides were exchanging direct strikes as recently as early June, this is a dramatic reversal. The arc of this détente can be read further in Iran Peace Deal Imminent and The US–Iran Clash: Strike-and-Warning Cycle.
The Mechanism of the Paradox — Why Peace Can Lift Safe Havens
The core question is this: with the war ending, why could gold, silver and bitcoin rise? The answer lies in a chain. ① When the truce reopens Hormuz, oil stabilizes. ② As oil falls, the energy costs that had been driving prices up recede, cooling US inflation. ③ With prices contained, the Fed — long pinned down by oil — finally gains room to cut rates. ④ As the Fed pivots to cuts, the dollar weakens and real rates fall. ⑤ Non-yielding gold and silver, and the risk asset bitcoin, react most strongly to exactly this “weak dollar, low rate” environment.
In other words, what the war lifted was a “fear premium,” while what peace can lift is a “liquidity premium.” In the short term a correction may come as the war premium drains, but the longer, stronger driver comes from the Fed’s cuts. How the strong dollar has weighed on assets is laid out in Dollar Investing — How Long Will the Strong Dollar Last, and why the Fed was tied to oil is covered in Fed Rate Outlook.
History backs this logic. In phases where the Fed began cutting rates (2019, 2020), gold rallied in earnest, and bitcoin too rose sharply on a weak dollar and abundant liquidity. The common thread was clear — the decisive lift came not from the crisis itself, but from the “rate cuts and dollar weakness” that responded to it. The inflection point markets watch is the same this time. It is not the “truce” headline, but whether that truce actually frees the Fed’s hands. So more than the June 19 signing itself, what matters is the curve oil and inflation trace afterward.
Truce → Hormuz reopening → stable oil → cooling inflation → Fed cuts → weak dollar and low rates → gold, silver and bitcoin strength. If any link in this chain breaks (e.g., delayed cuts), the outlook weakens. So the key trigger is, after all, the timing of the Fed’s first cut.

Gold — Even as the War Premium Fades, Cuts Provide Support
Start with gold. The truce is a double-edged sword for gold in the short term, since safe-haven demand can ebb and the war premium can drain. But the medium-term picture still leans upward. Major investment banks, citing Fed cuts, dollar weakness and geopolitical risk, see gold rising another 5–15% in 2026, with targets clustering around $4,500–5,000 per ounce. Goldman Sachs put year-end at $4,900. Compared with the low-$4,000s as of June, that is considerable room. On top of that, steady central-bank gold buying supports the floor. Why gold dipped temporarily even during the war, and why there is room for it to rise again, is covered in detail in Gold Price Outlook — Why Gold Fell During the War.
Silver — The Biggest Beta, the Biggest Volatility
Silver is the “high beta” asset of this phase. It is a safe haven like gold, yet it also carries industrial demand (solar, electronics), so when gold rises it rises more, and when it falls it falls harder. Bank of America saw silver at $65 per ounce in 2026, while more aggressive analysis cites $81–95 by year-end, and even an extreme $135 if physical supply shortages deepen. If the gold-to-silver ratio (gold price ÷ silver price) sits at a historical high, one reading is that silver has more room to catch up than gold. But the reverse also holds — the higher the volatility, the larger the potential loss. For the actual buying process for gold and silver, the Atomic Economy blog’s A Step-by-Step Guide to Buying Gold and Silver is a useful reference.
Bitcoin Outlook — Is It the Hour of Digital Gold?
Now the bitcoin outlook. Bitcoin is frequently named the “top beneficiary” of rate cuts and a weak dollar. As a non-yielding asset, its relative appeal grows as rates fall, and when the dollar weakens the “alternative store of value (digital gold)” narrative gains force. Institutional inflows via ETFs are also a variable unlike the past. But let us be honest — bitcoin price forecasts vary enormously by institution, and its short-term volatility is incomparably larger than gold or silver. Some forecasts put mid-2026 in the $60,000–70,000 range, while many institutions cite far higher targets for the same asset. More important than the number is the direction — a phase in which the Fed pivots to cuts is a favorable environment for bitcoin.
The Weak Link in the Bitcoin Outlook
Yet the bitcoin outlook has a clear weak link. First, the “digital gold” narrative has repeatedly failed the test in times of crisis. When real panic hits, bitcoin has often plunged like a risk asset rather than holding up as a safe haven. Second, it is vulnerable to regulatory and liquidity shocks. Third, if cuts are delayed or inflation flares again, bitcoin is the asset that wobbles first and hardest. In other words, bitcoin could be the biggest beneficiary of the “rate-cut scenario,” or the biggest casualty when that scenario goes wrong. Expectation and risk are attached in equal measure.
One more point: gold, silver and bitcoin do not always move together. In a calm cutting phase the three tend to rally in tandem, but when real panic strikes, gold rises while bitcoin plunges, and they diverge. We lump the three together as the “safe-haven trio,” but that alliance can break at any time depending on the severity of the crisis. So rather than viewing them as one basket, it is more realistic to assign roles — defense (gold), elasticity (silver) and a high-risk bet (bitcoin). However bullish you are on the bitcoin outlook, there is no reason to leave your position size to optimism too.
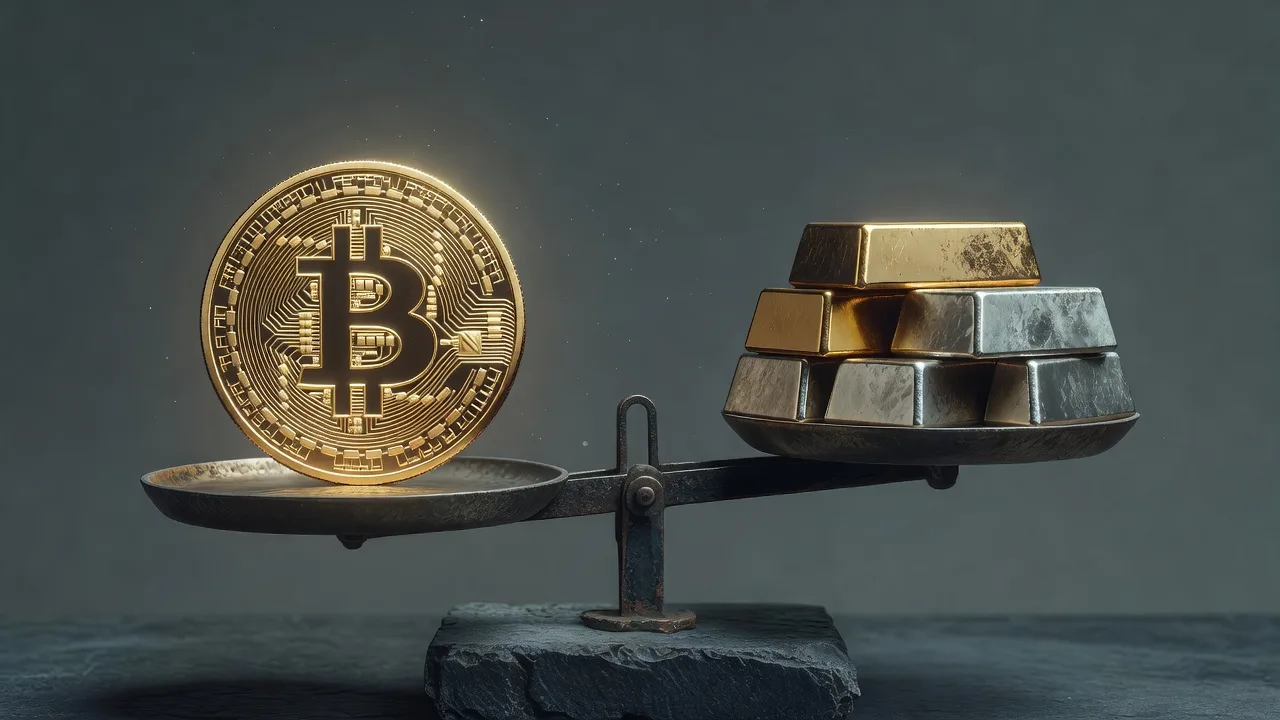
Bitcoin Outlook Scenarios — Where Does the Safe-Haven Trio Go?
We split the post-truce path into three. All hinge on “the pace of the Fed’s cuts.”
A. Cuts in Earnest — Joint Strength (likelihood: moderate-high)
The Hormuz reopening stabilizes oil and the Fed pivots to cuts in the second half. On a weak dollar and low rates, gold, silver and bitcoin all rise. The momentum is larger for bitcoin and silver than for gold.
B. Delayed Cuts — Divergence and Range-Bound (likelihood: moderate)
Inflation cools slowly and cuts are pushed back. Gold, supported by central-bank buying, stays firm, while bitcoin and silver trade in a volatile range.
C. Deal Cracks — Risk-Off (likelihood: low; tail risk)
If the signing is delayed or the deal wobbles, oil and the dollar swing again. Gold holds up on safe-haven demand, but bitcoin can plunge like a risk asset.
What Korean Investors Should Watch
Korean investors have one more variable: the won/dollar rate. Because gold and bitcoin are traded in dollars, even if a weak dollar lifts asset prices, returns in won shrink if the won strengthens alongside it. Conversely, if the high exchange rate holds, FX gains are added. So the “international price” and “the return in your account” move differently. There are three practical principles. First, level out volatility with split purchases rather than going all-in at once. Second, since the three assets differ in character (gold = defense, silver = high beta, bitcoin = high risk), divide your allocation. Third, check via indicators whether the “Fed cut” premise is holding. For a first step into gold, see 5 Ways for Beginners to Invest in Gold, and for tax-advantaged accounts, The ISA Account — Up to ₩2M Tax-Free is a useful reference.
This article provides information on macro and asset-market trends and is not investment advice recommending the purchase or sale of any specific asset (including gold, silver and bitcoin). Crypto and silver in particular are highly volatile and carry a significant risk of principal loss. Prices and forecasts are as of the time of writing and by institution, and may differ greatly from reality. Investment decisions and responsibility rest entirely with the individual.
Related Analysis
The cracks in dollar hegemony and the rise of gold continue in The Weakening of Dollar Dominance and the Rise of Gold, and the standing of precious metals amid geopolitical tension in Gold and Silver’s Currency War.
📚 Sources
- CNBC — US–Iran Truce Agreed, Signing June 19
- Al Jazeera — Trump Mentions Hormuz Reopening
- J.P. Morgan — Gold Price Outlook
Frequently Asked Questions (FAQ)
The war premium fades, but a bigger driver comes from the Fed. If truce → Hormuz reopening → stable oil → cooling inflation → Fed cuts → weak dollar and low rates plays out, non-yielding gold and silver and the risk asset bitcoin all benefit. But if cuts are delayed, this outlook weakens.
Major investment banks, citing Fed cuts, a weak dollar and geopolitical risk, see gold rising another 5–15% in 2026. Targets cluster around $4,500–5,000 per ounce, with Goldman Sachs at $4,900 by year-end. Central-bank buying supports the floor.
As a “high beta,” silver tends to rise more when gold rises. Year-end forecasts run $65–95, with extreme figures cited if supply shortages deepen. But the higher volatility means larger drawdowns too. A high gold-to-silver ratio is read by some as room for silver to catch up, but it is no guarantee.
It is hard to recommend a specific entry point. Bitcoin is the top candidate to benefit from a rate-cut, weak-dollar phase, but it has the highest volatility and the weakness of plunging like a risk asset in a crisis. Forecasts vary enormously by institution. It is wise to split and diversify and to judge within your own risk tolerance.
The won/dollar rate. For gold and bitcoin traded in dollars, even if a weak dollar lifts prices, returns in won can shrink if the won strengthens. Lower volatility with split purchases, divide allocation by each asset’s character (gold = defense, silver = high beta, bitcoin = high risk), and check whether the “Fed cut” premise holds.