Wartime Raw Material Self-Sufficiency Assessment: A Comparative Analysis of Five Nations’ War Sustainment Capacity
“Wartime raw material self-sufficiency assessment” is a critical instrument for national security.
Wartime raw material self-sufficiency is the most fundamental variable determining how long a nation can sustain a war. Without oil, tanks stop. Without steel, shells cannot be manufactured. Without rare earth elements, precision-guided weapons cease to function. This article conducts a quantitative assessment of seven strategic resource self-sufficiency rates and manufacturing conversion capabilities across five nations—South Korea, China, the United States, Russia, and Japan—and assigns each a War Sustainment Capacity (WSC) grade.
There is a maxim commonly used in U.S. Army doctrine regarding warfare: “Tactics wins battles, logistics wins wars.” As Erwin Rommel, the German general known as the “god of war,” stated: “The battle is fought and decided by the quartermasters before the shooting begins.” While battles are decided by tactics, it is an established fact that wars are decided by material superiority.
The overarching framework determining war sustainment capacity rests on two pillars: raw materials, addressing the question of “what,” and manufacturing capability, addressing “how much” and “how.” Today, we examine the “raw materials” dimension.
Analytical Framework for Wartime Raw Material Self-Sufficiency Assessment: The Three Pillars of War Sustainment Capacity (WSC)
War Sustainment Capacity refers to “how long and how intensely a nation can continue fighting after initiating hostilities.” Three pillars determine this capacity.
First, energy self-sufficiency. This concerns whether a nation can secure energy sources—oil, gas, uranium—domestically. If this pillar collapses, military operations become physically impossible.
Second, raw material self-sufficiency. This concerns whether a nation can secure minerals essential for weapons production—steel, rare earth elements, silicon, copper, and aluminum.
Third, manufacturing conversion capability. This concerns how rapidly peacetime industrial infrastructure can be converted to wartime military production, with robot density, shipbuilding capacity, and defense industrial base serving as key indicators.
These three pillars can be viewed as the intersection of M (Military) and E (Economic) within the DIME analytical framework. Below, we assess five nations across seven strategic resources, then synthesize manufacturing conversion capability to assign final WSC grades.
Disclaimer: The WSC grade assessment below is the author’s subjective framework analysis and may not be fully objective.
WSC Grading Criteria (Author’s Proprietary Analysis)
The WSC (War Sustainment Capacity) grades in this analysis are not based on any existing official military doctrinal system. Rather, they draw on the DIME framework, RAND Corporation’s War-Sustaining Industries analysis, and Global Firepower Index national power assessment factors to create a proprietary quantitative evaluation framework designed by this blog. The assessment covers seven strategic resources (oil, steel, rare earth elements, semiconductors, silicon, uranium, copper/aluminum), with scores assigned for each resource based on four indicators, then aggregated into an overall grade.
Assessment Indicators and Weights:
| Scoring Criterion | Weight |
|---|---|
| Self-sufficiency rate — Domestic production ÷ consumption. 80%+ = ✅, 30–80% = ⚠️, below 30% = ❌ | 40% |
| Supply stability — Degree of import source diversification + sphere of influence (allied/adversarial) + supply route vulnerability | 25% |
| Stockpile and substitution capacity — Strategic reserve days + availability of substitutes/recycling | 20% |
| Vertical integration — Completeness of domestic value chain from mining → refining → processing → finished products | 15% |
Grade Definitions
| Grade | Meaning |
|---|---|
| A | Capable of independent war sustainment for 12+ months even if external supply is cut off. Most resources self-sufficient. |
| A- | Most critical resources self-sufficient or secured through alliances. 1–2 bottlenecks exist but are resolvable in the medium term. |
| B+ | Multiple resources self-sufficient, but structural import dependence in energy or critical technology. Alliance supplementation required. |
| C | Possesses technological capability but depends on imports for most energy and raw materials. Crisis within weeks to months if sea lines of communication are severed. |
| C- | Similar vulnerability structure to C, compounded by additional constraints (military limitations, political uncertainty, etc.). |
Wartime Raw Material Self-Sufficiency Assessment 1: Oil — The Blood of Every War
Oil fuels every piece of military equipment—tanks, fighter jets, warships, transport vehicles, and generators. Without oil, an army literally cannot move. In World War II, the Imperial Japanese Navy was effectively neutralized after the Battle of Leyte Gulf, with oil shortages being the decisive cause.
| Country | Daily Production (million bbl) | Proven Reserves (billion bbl) | Self-sufficiency | Notes |
|---|---|---|---|---|
| USA | 21.4 | 45+ | ~105% | Net exporter since shale revolution |
| Russia | 10.8 | 80 | 100%+ | World’s 2nd–3rd largest exporter |
| China | 4.2 | 26 | ~30% | World’s largest importer (11M bbl/day) |
| Japan | 0.01 | 0.04 | ~3% | Nearly total import dependence |
| South Korea | 0 | 0 | 0% | No domestic oil fields, imports 2.76M bbl/day |
Source: OPEC Annual Statistical Bulletin 2025; EIA
WSC Perspective: The U.S. and Russia are fully oil self-sufficient, facing no constraints on the energy axis. China depends on imports for 70% but maintains overland pipelines from Russia and Kazakhstan, providing partial buffer against naval blockade. South Korea and Japan are effectively at 0%—if sea lines of communication (SLOC) are severed, they face an energy crisis within weeks.
South Korea’s crude oil imports come from Saudi Arabia (~25%), Iraq (12%), Kuwait (12%), UAE (10%), and the U.S. (10%), with Middle East dependence at 60%. Its survival hinges on two chokepoints: the Strait of Hormuz and the Strait of Malacca.
Wartime Raw Material Self-Sufficiency Assessment 2: Steel — The Skeleton of Shells, Tanks, and Warships
A single 155mm artillery shell requires approximately 45kg of steel. One tank uses 60–70 tons. One aircraft carrier consumes 100,000 tons. War is fundamentally a steel consumption contest, as the Russia-Ukraine war’s ammunition shortages on both sides demonstrate.
| Rank | Country | Crude Steel Production (Mt, 2024) | Global Share | Iron Ore Self-sufficiency |
|---|---|---|---|---|
| 1 | China | 1,005 | ~55% | 20% (80% imported) |
| 2 | India | 150 | 8.1% | Self-sufficient |
| 3 | Japan | 84 | 4.6% | 100% imported |
| 4 | USA | 80 | 4.3% | Largely self-sufficient |
| 5 | Russia | 71 | 3.9% | Fully self-sufficient |
| 6 | South Korea | 64 | 3.5% | 100% imported |
Source: World Steel Association 2024–2025
WSC Perspective: Russia is the only major power capable of full self-sufficiency from iron ore through crude steel. The U.S. is largely self-sufficient through domestic iron ore and scrap. China produces 55% of the world’s steel but imports 80% of its iron ore from Australia and Brazil (U.S. allies)—a paradoxical vulnerability.
South Korea possesses POSCO, one of the world’s most efficient steelmakers, but with 0% iron ore self-sufficiency, its technological prowess becomes meaningless if raw material imports are cut off.
Wartime Raw Material Self-Sufficiency Assessment 3: Rare Earth Elements — The Core Material of Precision-Guided Weapons
A single F-35 fighter jet contains approximately 417kg of rare earth elements. Neodymium magnets in precision-guided munitions, Aegis radar systems, night vision equipment, and electronic warfare systems all depend on rare earths.
| Country | Mining Output (kt REO, 2024) | Global Share | Refining Capacity Share |
|---|---|---|---|
| China | 270 | ~69% | ~90% |
| USA | 46 | ~12% | Minimal |
| Myanmar | 31 | ~8% | None |
| Australia | 14 | ~3.6% | Small |
| Russia | 3.7 | ~1% | Small domestic |
| South Korea | ~0 | ~0% | Minimal |
Source: USGS Mineral Commodity Summaries 2025
WSC Perspective: In rare earths, refining matters far more than mining. China controls ~69% of mining plus ~90% of global refining. Even the U.S., which mines 12%, sends most of its ore to China for refining before re-importing. Over 80% of South Korea’s processed rare earth imports come from China, along with 97.7% of graphite, 84% of lithium oxide, and 83.3% of cobalt oxide.
China’s December 2024 export ban on gallium, germanium, and antimony demonstrated that this weapon can be deployed in practice.
Wartime Raw Material Self-Sufficiency Assessment 4: Semiconductors — The Brain of Modern Warfare
A single Javelin anti-tank missile contains over 250 chips. Communications, radar, guidance, electronic warfare, and satellite navigation systems all depend on semiconductors. This is also the central battleground of the U.S.-China technology rivalry.
| Category | South Korea | Taiwan | China | USA | Japan |
|---|---|---|---|---|---|
| Manufacturing capacity | ~18% | ~22% | ~19% | ~12% | ~13% |
| Memory | World #1 | Small | Catching up | #3 | Kioxia |
| Advanced logic (<7nm) | 8% | 92% | Unable | Minimal | Unable |
| Design (Fabless) | Mid-range | MediaTek | Growing | #1 | Small |
Source: ICAEW 2025; Silverado 2024; Gartner 2024
WSC Perspective: South Korea’s world-leading memory semiconductor position (Samsung + SK hynix) is the only strategic asset that can function as an “offensive bargaining card.” However, this card’s prerequisite is that materials—neon gas (Ukraine 70%), hydrogen fluoride (Japan), gallium/germanium (China 80%+)—must be imported.
Related Links
Wartime Raw Material Self-Sufficiency Assessment 5: Silicon — The Foundation Element of Semiconductors, Solar, and Steel
Silicon is the base material for semiconductor wafers, a deoxidizer for steel (ferrosilicon), an aluminum alloy ingredient, and an essential element for solar panels.
| Country | Production (kt, 2024) | Global Share |
|---|---|---|
| China | 7,400 | ~80% |
| Russia | 580 | ~6% |
| Brazil | 390 | ~4% |
| Norway | 300 | ~3% |
| USA | Withheld | ~2% |
| South Korea | Small | <1% |
Source: USGS Mineral Commodity Summaries 2025
WSC Perspective: China produces approximately 80% of the world’s silicon. This single figure makes silicon one of the most concentrated strategic resources. Even the U.S. was importing 37% of its ferrosilicon from Russia until imposing tariffs with subsidy rates of 748% and dumping rates of 283% in 2024 to attempt supply diversification.
South Korea depends on imports for nearly all its silicon, except for a small amount of polysilicon (OCI).
Wartime Raw Material Self-Sufficiency Assessment 6: Uranium — Nuclear Weapons and Nuclear Power Fuel
Uranium is both a nuclear weapons material and nuclear power fuel. For uranium, enrichment rather than mining is the far more critical bottleneck. Only a handful of nations possess enrichment facilities capable of raising natural uranium’s U-235 concentration to 3–5% (reactor-grade) or 90%+ (weapons-grade).
| Country/Entity | Enrichment Capacity (million SWU/year) | Global Share |
|---|---|---|
| Russia (Rosatom) | ~27 | ~46% |
| URENCO (UK/Germany/Netherlands) | ~18 | ~30% |
| China (CNNC) | ~8 | ~14% |
| France (Orano) | ~7.5 | ~13% |
| USA (Centrus et al.) | ~1 | <2% |
Source: World Nuclear Association 2025; OECD-NEA/IAEA Red Book 2024
WSC Perspective: Russia’s Rosatom controls 46% of global uranium enrichment. The U.S. operates 93 reactors (the world’s largest fleet) yet has almost no domestic enrichment capability, depending on Russia for approximately 25%. This is America’s hidden strategic vulnerability. Projects including $2.7 billion in DOE investment, Urenco USA expansion, and new Orano facilities are underway targeting de-Russification by 2030–2035, but completion requires time.
South Korea operates 24 reactors with 0% mining and enrichment capability, maintaining fuel reserves of 2–3 years. For real-time uranium price trends, see the commodities page.
Links related to raw material prices
Raw Materials Market PageWartime Raw Material Self-Sufficiency Assessment 7: Copper and Aluminum — Ammunition, Wiring, and Aircraft
Shell casings are copper alloy. Wiring and motors require copper. Aircraft and missile weight reduction depends on aluminum alloys.
Copper: Mining is led by Chile (22%), Peru (10%), and Congo (10%), while refining is dominated by China (44%). South Korea’s mining and refining are negligible.
Aluminum: Bauxite mining is led by Australia (25%), Guinea (25%), and China (21%). Smelting is dominated by China (59%), India (6%), and Russia (5%). South Korea’s share is minimal.
Source: USGS MCS 2024; USGS Global Maps 2023
Wartime Raw Material Self-Sufficiency Assessment: Manufacturing Conversion Capability — From Peacetime Factories to Wartime Arsenal
Having raw materials without manufacturing capability is useless; having capability without raw materials means nothing can be produced. Both dimensions must be evaluated simultaneously.
| Indicator | South Korea | China | USA | Russia | Japan |
|---|---|---|---|---|---|
| Manufacturing % of GDP | ~25% | ~28% | ~11% | ~14% | ~20% |
| Robot density (per 10k workers) | 1,012 (#1) | 470 (#3) | 295 (#10) | Low | 419 (#5) |
| Annual robot installations | 30.6k (#6) | 295k (#1, 54%) | 34.2k (#3) | Small | 43.7k (#2) |
| Total industrial robot stock | ~100k | 2M+ (#1) | ~380k | Small | ~400k |
| Shipbuilding capacity | World #1–2 | World #1 (volume) | Minimal | Limited | World #3 |
| Defense exports | K-Defense rising fast | Large | World #1 | World #2 | Limited |
Source: IFR World Robotics 2024; CSIS; Grand View Research
WSC Perspective: In WWII, America’s strength was its ability to convert civilian manufacturers like Ford and GM to military production. However, in 2026, U.S. manufacturing accounts for only 11% of GDP, and its robot density ranks just 10th globally. Meanwhile, China maintains its “world’s factory” status with 295,000 annual robot installations (54% of global total), over 2 million industrial robots in operation, and more than 30,000 smart factories. Under the Party-Military-Enterprise integrated mobilization system, the speed of civilian-to-military factory conversion is incomparable to Western democracies.
South Korea’s world-leading robot density (1,012 per 10,000 workers) is notable, but this is concentrated in a few major corporations (automotive, semiconductors), and the overall breadth of its manufacturing base cannot match China’s. However, its shipbuilding technology (world #1–2) and K-Defense (K9 howitzer, KF-21, ammunition exports) are strategic assets with high alliance bargaining value.
Composite War Sustainment Capacity (WSC) Grade Assessment
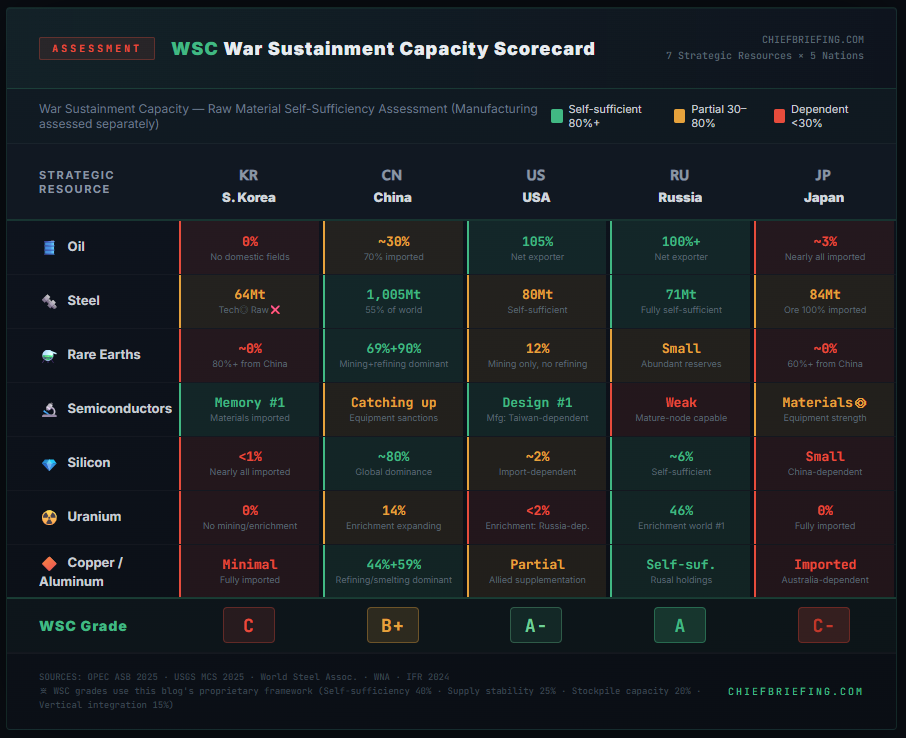
The seven resource self-sufficiency assessments plus manufacturing conversion capability are synthesized to assign A–F grades to five nations. The evaluation criterion is “the duration and intensity of war sustainment possible if external supply is cut off.”
Composite Scorecard
| Strategic Resource | South Korea | China | USA | Russia | Japan |
|---|---|---|---|---|---|
| Oil | ❌ 0% | ⚠️ 30% | ✅ 105% | ✅ 100%+ | ❌ 3% |
| Steel | ⚠️ Tech◎ Raw❌ | ✅ 55% (Raw⚠️) | ⚠️ Self-sufficient | ✅ Fully self-sufficient | ⚠️ Tech◎ Raw❌ |
| Rare Earths | ❌ 0% | ✅ Dominant | ⚠️ Mining only | ⚠️ Potential | ❌ 0% |
| Semiconductors | ✅ Memory #1 | ⚠️ Catching up | ✅ Design #1 | ❌ Weak | ⚠️ Materials strength |
| Silicon | ❌ <1% | ✅ 80% | ⚠️ 2% | ✅ Self-sufficient | ❌ Small |
| Uranium | ❌ 0% | ⚠️ Expanding | ❌ No enrichment | ✅ Enrichment 46% | ❌ 0% |
| Copper/Aluminum | ❌ Minimal | ✅ Refining dominant | ⚠️ Partial | ✅ Self-sufficient | ❌ Import-dependent |
| Manufacturing conversion | ⚠️ Robots #1/small scale | ✅ Overwhelming | ⚠️ Base weakened | ⚠️ Quantity limited | ⚠️ Scale limited |
Final WSC Grades
| Country | Grade | Rationale |
|---|---|---|
| Russia | A | Full energy, mineral, and food self-sufficiency. World #1 in uranium enrichment. Semiconductors are the only weakness, but mature-node chips can be produced domestically. The most durable structure for prolonged conflict. |
| USA | A- | Full energy self-sufficiency, strongest allied resource network. Weaknesses: rare earth refining (China dependence), uranium enrichment (Russia dependence → 2030 resolution), semiconductor manufacturing (Taiwan dependence). |
| China | B+ | Overwhelming manufacturing power and mineral self-sufficiency. Weaknesses: 70% oil import dependence (maritime vulnerability), iron ore dependence on Australia, semiconductor equipment sanctions. Progressively compensating for weaknesses over time. |
| South Korea | C | Strong technology (semiconductors, shipbuilding, defense), but total import dependence for all energy and raw materials. War sustainment becomes impossible within weeks to months if sea lanes are cut. Alliance maintenance is a survival prerequisite. |
| Japan | C- | Similar structural vulnerability to South Korea. Additional constraints: uncertain nuclear reactor restarts and military limitations under Article 9. Semiconductor materials and equipment strengths serve as bargaining cards. |
Historical Lessons: WWII’s Material War and the U.S.-China Raw Material Contest
History repeatedly shows that raw material self-sufficiency determines the outcome of wars. In WWII, the United States functioned as the “Arsenal of Democracy,” self-sufficient in oil, steel, aluminum, and copper.
In contrast, Germany depended on Romania’s Ploiești oil fields and Swedish iron ore, while Japan staked its survival on oil and bauxite from the Southern Resource Area. Both nations saw their war-fighting capability rapidly collapse once supply lines were severed.
In 2026, the U.S.-China raw material landscape presents an entirely different picture from WWII. A resource-by-resource comparison reveals that both sides simultaneously possess critical vulnerabilities and overwhelming strengths.
| Resource | USA | China | Advantage |
|---|---|---|---|
| Oil | 21.4M bbl/d (105% self-sufficient) | 4.2M bbl/d (70% imported) | U.S. decisive advantage |
| Steel | 80Mt | 1,005Mt | China decisive (12.5x) |
| Rare earths (mining) | 46kt (12%) | 270kt (69%) | China decisive |
| Rare earths (refining) | Minimal | 90% of world | China monopoly |
| Silicon | ~2% | ~80% | China monopoly |
| Semiconductor design | World #1 (Nvidia, AMD) | Catching up | U.S. advantage |
| Semiconductor manufacturing | ~12% (+ Taiwan ally 22%) | ~19% | U.S. allied bloc advantage |
| Uranium enrichment | <2% (25% Russia-dependent) | 14% (expanding) | Both sides vulnerable |
| Copper refining | Small | 44% of world | China advantage |
| Aluminum smelting | Small | 59% of world | China decisive |
The picture this table reveals is clear. The U.S. holds the advantage in “energy + advanced technology,” while China holds the advantage in “industrial minerals + manufacturing volume.”
Unlike WWII, when the U.S. was self-sufficient in both energy and industrial raw materials while sustaining the entire Allied coalition, today’s America depends substantially on China for the “lifeblood of industry”—rare earths, silicon, copper, and aluminum.
The alliance network variable adds another dimension. U.S. allies—Australia (iron ore #1, uranium reserves #1), Canada (oil, uranium), Taiwan (TSMC), South Korea (Samsung, SK), and Japan (semiconductor materials)—substantially compensate for American weaknesses.
Paradoxically, the fact that 80% of the iron ore feeding China’s steel production comes from U.S. allies Australia and Brazil represents China’s hidden vulnerability.
In conclusion, the U.S.-China raw material contest is an asymmetric confrontation of “energy and alliances vs. minerals and volume”—not a decisive victory for either side, but a structure of mutual dependence and mutual vulnerability. This is the fundamental reason both nations choose a “war without bullets” fought through economic means (tariffs, export controls, supply chain restructuring) rather than full-scale military confrontation.
Strategic Implications: America’s Three Vulnerabilities and the Time Variable
Despite receiving a WSC grade of A- thanks to its overwhelming energy self-sufficiency, the United States faces three structural vulnerabilities that form the ceiling of its war sustainment capacity.
Vulnerability of The USA
Vulnerability 1: Rare earth refining dependence on China. The U.S. mines 12% of rare earths but depends on China for 90% of refining. With 417kg of rare earths required per F-35 fighter jet, this represents a bottleneck in fighter production itself.
Mountain Pass mine reactivation and Australia’s Lynas Corporation’s Texas refining facility construction are underway, but establishing refining capability will take 5–7 years.
Vulnerability 2: Uranium enrichment dependence on Russia. Being the world’s largest nuclear power operator (93 reactors) while possessing less than 2% domestic enrichment capability is America’s Achilles’ heel in energy security.
With approximately 25% dependence on Russia’s Rosatom, the U.S. is pursuing DOE $2.7 billion investment, Urenco USA expansion, and new Orano Oak Ridge facilities, but complete de-Russification targets 2030–2035.
Vulnerability 3: Advanced semiconductor manufacturing dependence on Taiwan. 92% of advanced chips below 7nm are produced at Taiwan’s TSMC. This is the central issue in the U.S.-China technology rivalry, and while CHIPS Act-funded domestic fab construction (TSMC Arizona, Samsung Taylor) is underway, full-scale operation is years away.
Commonalities and Trends in the US-China War
What these three vulnerabilities commonly point to is the variable of “time.” The U.S. is pursuing massive investments to address all three weaknesses by 2030.
China, conversely, is filling its own gaps through semiconductor self-reliance, energy import diversification, and overland pipeline expansion.
The war favorable to the U.S. is a “fast war.” Energy self-sufficiency, advanced weapons superiority, and alliance networks provide decisive advantages in short-duration conflicts.
The war favorable to China is a “long war.” Manufacturing volume, mineral self-sufficiency, and technology catch-up over time work in China’s favor in protracted conflicts. This is why, in a Taiwan Strait scenario, the U.S. plans for “resolution within 72 hours” while China envisions “prolonged blockade and attrition.”
As the post-IEEPA ruling tariff restructuring demonstrates, the U.S. is seeking to gain the upper hand in this time race through economic means (tariffs, export controls, allied supply chain restructuring) rather than military means. This is the essence of the U.S.-China conflict in 2026, and the raw material self-sufficiency lens reveals this dynamic most clearly.
– <a href=”https://asb.opec.org/” target=”_blank”>OPEC Annual Statistical Bulletin 2025</a> – <a href=”https://worldsteel.org/data/world-steel-in-figures/” target=”blank”>World Steel Association — World Steel in Figures 2024</a> – <a href=”https://pubs.usgs.gov/periodicals/mcs2025/mcs2025.pdf” target=”blank”>USGS Mineral Commodity Summaries 2025</a> – World Nuclear Association — Uranium Mining, Enrichment (world-nuclear.org) – OECD-NEA/IAEA “Uranium 2024: Resources, Production and Demand” Red Book – Atlantic Council, National Interest, Bellona Foundation — Uranium Enrichment Analysis (2025) – ICAEW, Silverado, TrendForce, Gartner — Semiconductor Industry (2024–2025) – IFR World Robotics 2024 — Robot Density and Installations (ifr.org) – CSIS “China’s Industrial Robots” (chinapower.csis.org) – <a href=”https://www.motie.go.kr/” target=”blank”>Korea Ministry of Trade, Industry and Energy — Critical Minerals Strategy (2023)</a>
War Sustainment Capacity is a concept for evaluating how long and at what intensity a nation can sustain military operations independently or with allies after initiating hostilities. Its core pillars are raw material self-sufficiency (the “what” dimension) and manufacturing conversion capability (the “how much and how” dimension). This article focuses on the raw materials dimension.
The U.S. possesses full oil and natural gas self-sufficiency (105%) as an energy strength, while its weaknesses include rare earth refining (90% China dependence), silicon (80% China), and uranium enrichment (25% Russia). China dominates global rare earth, silicon, aluminum, and copper refining but suffers from 70% oil import dependence (maritime vulnerability) and 80% iron ore imports (Australia/Brazil). Both sides simultaneously possess critical vulnerabilities and overwhelming strengths—an asymmetric structure.
Russia is the only major power capable of near-complete domestic self-sufficiency across oil, natural gas, uranium, iron ore, rare earths, silicon, aluminum, copper, and food. Its world #1 position in uranium enrichment (46%) is particularly decisive for nuclear force maintenance. Semiconductors are the sole weakness, but mature-node chips needed for military equipment can be produced domestically.
Time favors China. China is progressively compensating for its weaknesses through semiconductor self-reliance, energy import diversification, and overland pipeline expansion. The U.S. is also pursuing domestic rare earth refining, uranium enrichment, and semiconductor manufacturing, but completion extends beyond 2030. Therefore, the scenario favorable to the U.S. is a short decisive engagement, while the scenario favorable to China is protracted attrition warfare.
South Korea’s critical raw material self-sufficiency is effectively zero: oil 0%, rare earths ~0%, silicon under 1%, uranium 0%, iron ore 0%. Rated WSC grade C, South Korea possesses strong technology (memory semiconductors #1, shipbuilding #1–2, K-Defense) but depends on imports for all energy and raw materials. If sea lines of communication are severed, war sustainment becomes impossible within weeks to months.